When discussing strategies used in Risk, it is often necessary to illustrate various manoeuvres and expansions using a map. Showing every map state and every step taken by each player can be tedious and difficult to read by others. Instead of recording and showing exactly how many armies each player uses over the course of the game, it is possible to look only at the major events occurring over time.
Bold Move Sequence graph, or BOMS, is a graph that captures only the players' bold moves used through a Risk game (or any game for that reason). In any strategy game, players may have to deal with small incursions, tactically reposition their armies, gather resources and so on. These, as important as they are, may only confuse an analyst in understanding what exactly is taking place in a game. It is much better if a game is viewed based on major moves made by the players; the so-called 'Bold Moves'.
A Bold Move is defined as:
“A move by a player that significantly changes the nature of the game and demands a response from other players.”
BOMS graph attempts to capture the bold moves. A series of consecutive BOMS graphs show how a game develops over time and how players expand their empires. Notice that it is not essential to show every move made by every player. If a player cannot respond to a bold move (i.e. he only makes a small defensive army placement), his move is skipped and the next major move is shown.
The key to a BOMS graph is shown below.
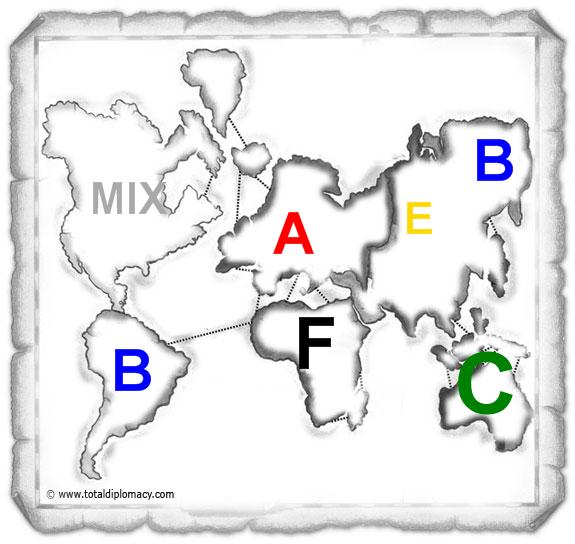
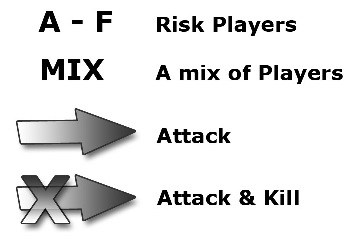
Each arrow represents a major move made by a specific player towards another. Each player is represented by a letter. The placement of each letter on the map shows that the player owns all or most of that particular area or continent.
The font size represents the relative strength of a player's foothold. A mixture of players in an area is represented by MIX. An X shown on an arrow represents a move made by an attacking player that eventually killed the attacked player. All the bold moves by a player in a single turn must be shown in a single BOMS graph.
Study an example walkthrough of a Risk game to see how BOMS graphs are created and used.
BOMS graphs are discussed in Chapter 9 of Total Diplomacy along with a number of examples and walkthroughs.